¶ Purpose
Verifying that the Pathfinder data matches the system of record is key to ensure data accuracy, consistency, and data integrity. By regularly validating reports against the authoritative sources, you enhance the ability to make decisions on the reported data. This practice ensure that any client facing reports or dashboards are showing the most accurate information as possible. Additionally, a Raw Data report can help you troubleshoot any tagging issues that may be preventing metrics from showing correctly in the reports or visualizations.
¶ Helpful Items
- All Tracer reports can be downloaded as a CSV or XLSX file and opened in Excel for further filtering or pivots
- For API based platform, all dimensions and metrics available can be viewed in the Tracer API Field List
- The date ranges and the columns retrieved are fully customizable to pull the data for comparison to the system of record
¶ Walkthrough
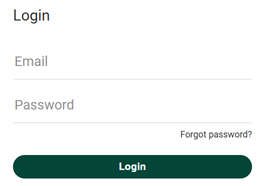
- Login
- NOTE: If you do not have an account, please email the Pathfinder Team's email alias and we will grant you access to the portfolio (s) you need.
- Navigate to the Portfolio you want to pull data from
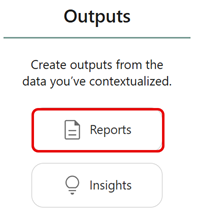
- Once in the portfolio, go to Outputs => Reports
- To add a new report, click the + button (located next to the search bar)

- Give the report a name
- NOTE: The system defaults the name to Untitled report. To help other user's in the system know what the report's intent is, it can be beneficial to include some details about its purpose in the name.
- Create a new table
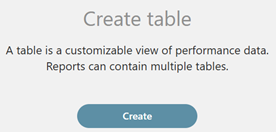
- Give your table a name
- NOTE: Tables in Tracer reports can be thought of as Excel workbook sheets
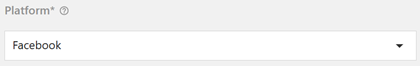
- Select the platform you want to pull data from
- NOTE: For this guide we will focus on pulling data from Meta
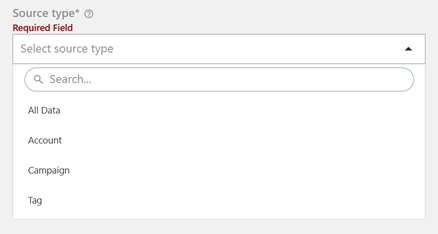
- Select your Source Type
- NOTE: For Raw Data Reports, All Data is typically the best option to use
- DEFINITIONS:
- All data => This will be all available data for the selected source (s). If there is more than one account in the Portfolio for a single source platform, this will include all accounts.
- Account => This will let you cherry pick individual accounts from the platforms.
- Campaign => This will let you narrow the report table down to whatever campaign (s) you are looking for
- Tag => This will narrow the report down to particular tagged items
- NOTE: Do not use this option in a raw data report as it may have unintended consequences
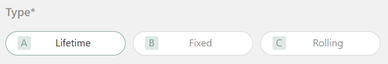
- Set your desired date range
- DEFINITIONS:
- Lifetime => This will pull all available data
- Fixed => This will allow you to set a starting date and ending date of your choosing
- Rolling => This will allow your report to automatically pull a different range of dates based on the criteria you select
- DEFINITIONS:
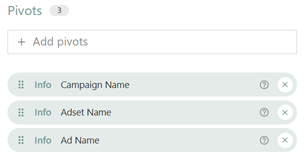
- Select the Pivots that you want to break your data down into
- NOTE: Pivots typically used dimensions (i.e., text fields) from the data
- EXAMPLE: For Meta, we may want to see the Campaign Name, the Adset Name, and the Ad name to mimic the standard reporting in Business Manager
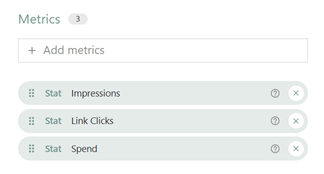
- Select the Metrics that you want to report on
- EXAMPLE: For Meta, we may want to see the Spend, Impressions, and Link Clicks
- Run the report
- If any discrepancies are identified, please send a Support Request to the Pathfinder team